
The Most Dangerous (and Safest) Cities in Pennsylvania
In an effort to determine which cities in the state of Pennsylvania are the safest and which are the most dangerous, The Law Offices of Gary E. Gerson enlisted the help of data visualization firm 1Point 21 Interactive.
First, we had to identify factors that directly affect the personal safety of each city’s residents. While crime obviously looms large as a significant factor, criminal justice experts and even the FBI warn against making judgements using solely crime statistics. So, we collected and analyzed data on 15 metrics known to have an impact on crime for all Pennsylvania cities and townships with populations over 25,000. These metrics fall into three categories:
- Crime
- Police Presence and Investment
- Community Socioeconomic Factors
Based on our research, here are the most dangerous (and safest) cities in Pennsylvania.
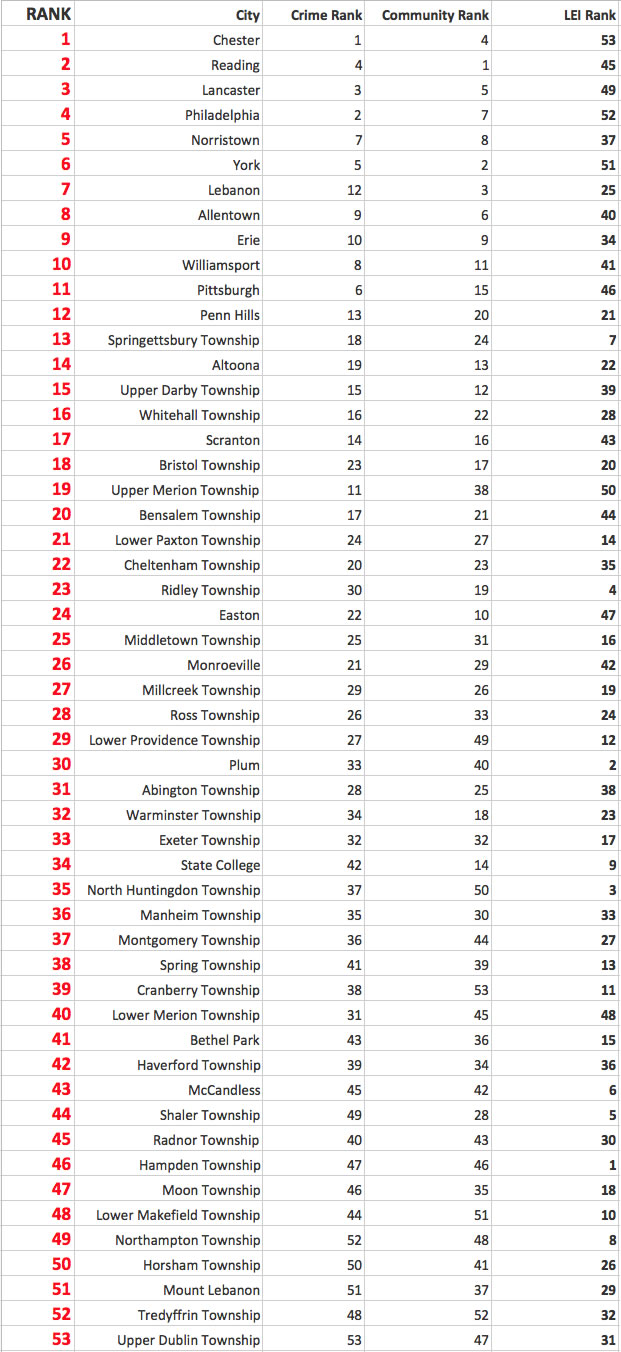
The Most Dangerous (and Safest) Cities in Pennsylvania
*Where 1 is most dangerous
Key Findings
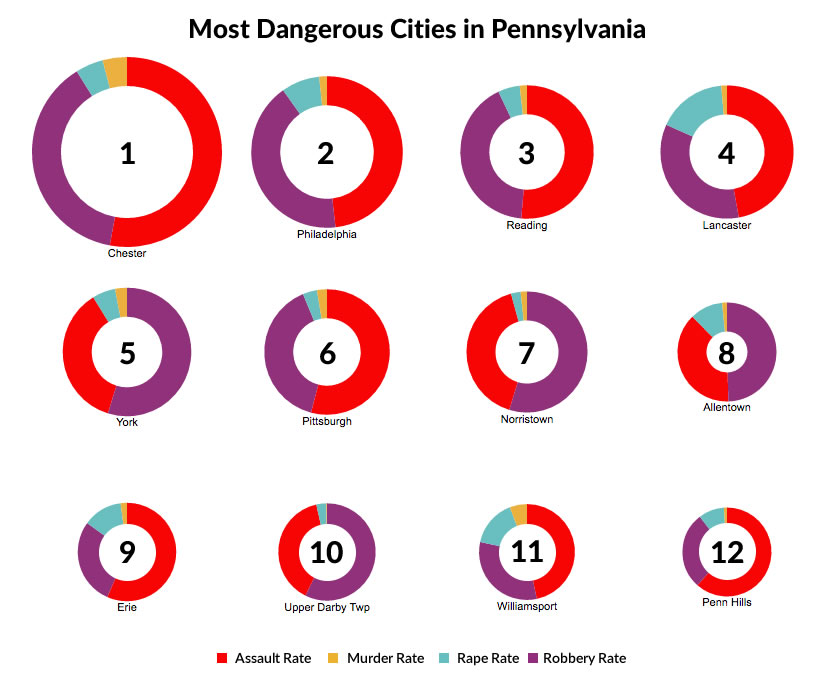
- Chester, the most dangerous city in our study, had a violent crime rate – approximately 1,615 crimes per 100,000 residents – more than double that of any other city besides Philadelphia. Chester also had the highest murder rate, robbery and aggravated assault rate.
- Lancaster had the highest rate of sexual assault by nearly double. In fact, the city had nearly as many reported rapes (80) as Pittsburgh (82), a city with five times as many people.
- Educational attainment makes a huge difference: The national high school graduation rate is 86.7 percent; nine of the 10 cities we found to be most dangerous fell below this mark, while all of the ten safest cities were well above it.
- Chester and Reading were the only two cities with unemployment rates over 20 percent. Overall, the ten most dangerous cities had an average unemployment rate of 14.75 percent, while the ten safest cities came in at an average of 5.25 percent.
- Economic factors: All of the ten most dangerous cities have median household income well below the national average of $53,889 (they averaged nearly $20,000 lower) while had poverty levels significantly higher than the national average of 15.7 percent (In fact, on average the rates were nearly double). At the same time, the median incomes of the ten safest cities where much higher than national averages ($96,132 on average) and poverty rates where many times lower (4.4 percent on average).
- Lebanon had a police budget of $177.12 per capita, by far the lowest budget of the 10 most dangerous cities. It also had the fewest officers per capita of any cities in the top ten.
*It’s important to note that occasionally a city will not report their crimes to the UCR Program, which was the case with Wilkes-Barre, PA in 2015. As such, they are not included in our rankings.
Crime Dimension Detail
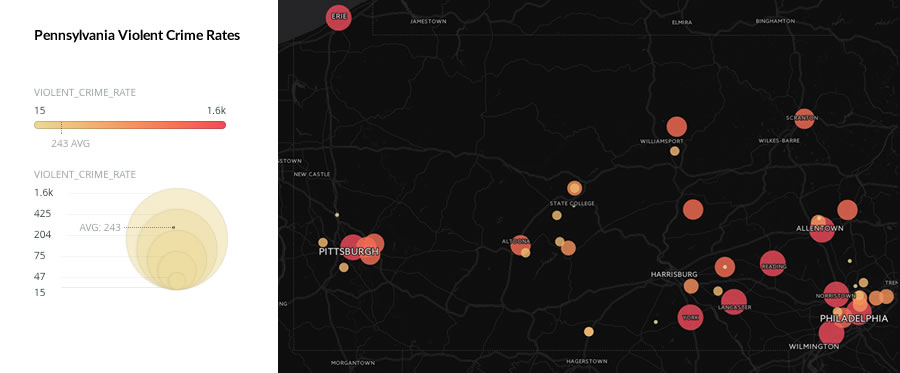
Violent crime is weighted heaviest in our rankings, as it has the most direct impact on personal safety. Defined in the FBI’s UCR Program “as those offenses which involve force or threat of force”, violent crime includes all instances of murder and nonnegligent manslaughter, forcible rape, robbery, and aggravated assault. Chester is the Pennsylvania city with the highest overall violent crime rate, nearly 37 percent higher than the next closest city, Philadelphia. The murder rate there, 67 per 100,000 residents, is more than triple that of all cities included in our study.
12 Cities with the Highest Violent Crime Rate
Community and Law Enforcement Investment Detail
Investment in a city’s police department can either be done out of necessity or as a prevention effort; a city has a low crime rate and wants to keep it that way, or a city wants to reverse the trend of high crime rates. We examined spending on a budget per capita basis, and the four most dangerous cities (Chester, Reading, Lancaster and Philadelphia) ranked in the top 8 in law enforcement investment.
Chester ranked first in spending, while York and Philadelphia were third and second to most, respectively. Philadelphia spent $642 million on law enforcement, seven times that of any other city. Based on this, it’s obvious that budget alone doesn’t tell the whole story for some cities; Philadelphia has 40 officers per 10,000 residents, double that of any other city on our survey using that same metric, and yet their violent crime rate was the second highest of all cities.
While cities like Chester and Philadelphia have by far the highest violent crime rates, there is evidence that the investment in law enforcement is paying off. Despite ranking number one and two, both cities have seen a significant drop in violent crime since 2012. Chester’s rate dropped from 2,201 per 100,000 to 1,615 and Philadelphia’s fell from 1,160 to 1,028 ( a more modest decrease on rate basis, however represents more than 1,700 less actual violent crimes being committed).
Community Factors
It’s been demonstrated that a city’s poverty, education and unemployment levels have great effect on its crime. Pennsylvania does spend the sixth most ($26.5 billion) out of all states on K-12 education, but their unemployment rate is seventh worst in the country. However, statewide averages do not necessarily hold true at the city level.
Unemployment
The city of Reading, which was seventh most dangerous, has a 20.1 percent unemployment rate, most of any city surveyed. Their average income is slightly more than $26,000 and close to 40 percent of its residents live below the poverty level. This is just one of many examples in Pennsylvania and across the country that one has a domino effect on the others.
Poverty
All of the ten most dangerous cities in Pennsylvania have poverty rates of 22.3 percent or higher. While the average poverty rate statewide was 13.6 percent, it’s clear that the dangerous cities are much worse for the wear. Poverty has been identified by many psychologists as a root cause of crime; or at the very least, is identified as a “risk factor.”
The link between poverty and crime is not discriminatory; according to the Bureau of Justice statistics, poor whites had the highest crime rate (46.4 per 1,000) among the surveyed races, which included blacks and Hispanics.
Educational Attainment
The link between educational attainment and increased crime has been demonstrated by many studies. According to the School Library Journal, “dropouts are 3.5 times more likely to be arrested than high school graduates.” In six of the ten most dangerous cities in our study, fewer than 82 percent of adults had graduated high school, led by Reading with just 65 percent. Conversely, the ten safest cities all had high school educational attainment rates of 88 percent or higher.
Methodology
The results of this study reflect our research into 15 separate metrics known to have an effect on crime and personal safety. The rankings are based on each cities performance using the corresponding weights:
Crime: Full Weight x 4
- Total Violent Crime Rate per 100,000: Full Weight
- Murder and Homicide Rate per 100,000: Full Weight
- Forcible Rape Rate per 100,000: Full Weight
- Robbery Rate per 100,000: Full Weight
- Aggravated Assault Rate per 100,000: Full Weight
- Property Crime per 100,000: Half Weight
Police Investment: Full Weight
- Police Officers per 10,000: Full Weight
- Police Department Budget per Capita: Full Weight
Community Factors: Full Weight
- Poverty Rate: Full Weight
- Unemployment Rate: Full Weight
- Median Income: Full Weight
- Educational Attainment, High School: Full Weight
- Population Density
Data Sources
- Crime Data: FBI’s Uniform Crime Reporting (UCR) Program: Using “Offenses Known to Law Enforcement” report.
- Demographic Information: U.S. Census Reports
- Police Department and Budget Data: City Budgets and Uniform Crime Reporting (UCR) Program
If you need help choosing the best criminal defense attorney in Pittsburgh, contact The Law Offices of Gary E. Gerson today. Our legal team is ready to handle cases ranging from sexual assault to drug charges.